Collared Sparrowhawk
Accipiter cirrocephalus
ABR description
The following is extracted from the Annual Bird Report for the twelve months to June 2017.
Common, breeding resident/sum. migrant
Regularly observed throughout the region, especially in the warmer months.
General: 118 records (3 WOO), from 47 widespread urban and rural grid cells, but with a reporting rate of 0.8%, down 43% on the 30YA of 1.5%. Numbers ranged from 1-3 birds. Recorded in 49 weeks of the year, 20% of records coming in winter, 23% spring, 34% summer and 23% autumn. Breeding recorded between br/16 Jul Higgins (CnM1) and on/15 Jan Uriarra East Reserve (HeS1). Breeding has been recorded for sparrowhawks in 15 of the previous 30 years.
GBS: A surprising 92 records, from 20 sites across 15 grid cells, mainly urban but including rural Wamboin and Carwoola. Common in none. The reporting rate of 3.6% is the only instance of a raptor exceeding its 30YA, which in this case is 2.1%. Its seasonal pattern was similar to the general records, above. Mostly single birds, with some twos.

Abundance
Abundance is the average number of birds of that species per survey. Where the species was observed (presence recorded) but the number of birds seen was not recorded, this is treated as a count of zero.
Abundance by year
This chart shows the abundance of Collared Sparrowhawk between 1982 and 2017. 
Abundance by month
This chart shows the monthly abundance of Collared Sparrowhawk. The blue lines show the abundance for the twelve months to June 2017 and the bars show the average abundance for the period 1982 to 2017. 
Abundance by season
This chart shows the seasonal abundance of Collared Sparrowhawk. The blue lines show the seasonal abundance for the twelve months to June 2017 and the bars show the average seasonal abundance for the period 1982 to 2017. 
Abundance data
| Month | Season | ||||||||||||||||||
|---|---|---|---|---|---|---|---|---|---|---|---|---|---|---|---|---|---|---|---|
| Period | Jul | Aug | Sep | Oct | Nov | Dec | Jan | Feb | Mar | Apr | May | Jun | Winter | Spring | Summer | Autumn | All | ||
| All years | |||||||||||||||||||
| All | 0.0 | 0.0 | 0.0 | 0.0 | 0.0 | 0.0 | 0.0 | 0.0 | 0.0 | 0.0 | 0.0 | 0.0 | 0.0 | 0.0 | 0.0 | 0.0 | 0.0 | ||
| Previous years | |||||||||||||||||||
| All previous years | 0.0 | 0.0 | 0.0 | 0.0 | 0.0 | 0.0 | 0.0 | 0.0 | 0.0 | 0.0 | 0.0 | 0.0 | 0.0 | 0.0 | 0.0 | 0.0 | 0.0 | ||
| Previous 30 years | 0.0 | 0.0 | 0.0 | 0.0 | 0.0 | 0.0 | 0.0 | 0.0 | 0.0 | 0.0 | 0.0 | 0.0 | 0.0 | 0.0 | 0.0 | 0.0 | 0.0 | ||
| Previous 20 years | 0.0 | 0.0 | 0.0 | 0.0 | 0.0 | 0.0 | 0.0 | 0.0 | 0.0 | 0.0 | 0.0 | 0.0 | 0.0 | 0.0 | 0.0 | 0.0 | 0.0 | ||
| 10 year groups | |||||||||||||||||||
| [2007,2017) | 0.0 | 0.0 | 0.0 | 0.0 | 0.0 | 0.0 | 0.0 | 0.0 | 0.0 | 0.0 | 0.0 | 0.0 | 0.0 | 0.0 | 0.0 | 0.0 | 0.0 | ||
| [1997,2007) | 0.0 | 0.0 | 0.0 | 0.0 | 0.0 | 0.0 | 0.0 | 0.0 | 0.0 | 0.0 | 0.0 | 0.0 | 0.0 | 0.0 | 0.0 | 0.0 | 0.0 | ||
| [1987,1997) | 0.0 | 0.0 | 0.0 | 0.0 | 0.0 | 0.0 | 0.0 | 0.0 | 0.0 | 0.0 | 0.0 | 0.0 | 0.0 | 0.0 | 0.0 | 0.0 | 0.0 | ||
| 5 year groups | |||||||||||||||||||
| [2012,2017) | 0.0 | 0.0 | 0.0 | 0.0 | 0.0 | 0.0 | 0.0 | 0.0 | 0.0 | 0.0 | 0.0 | 0.0 | 0.0 | 0.0 | 0.0 | 0.0 | 0.0 | ||
| [2007,2012) | 0.0 | 0.0 | 0.0 | 0.0 | 0.0 | 0.0 | 0.0 | 0.0 | 0.0 | 0.0 | 0.0 | 0.0 | 0.0 | 0.0 | 0.0 | 0.0 | 0.0 | ||
| [2002,2007) | 0.0 | 0.0 | 0.0 | 0.0 | 0.0 | 0.0 | 0.0 | 0.0 | 0.0 | 0.0 | 0.0 | 0.0 | 0.0 | 0.0 | 0.0 | 0.0 | 0.0 | ||
| [1997,2002) | 0.0 | 0.0 | 0.0 | 0.0 | 0.0 | 0.0 | 0.0 | 0.0 | 0.0 | 0.0 | 0.0 | 0.0 | 0.0 | 0.0 | 0.0 | 0.0 | 0.0 | ||
| [1992,1997) | 0.0 | 0.0 | 0.0 | 0.0 | 0.0 | 0.0 | 0.0 | 0.0 | 0.0 | 0.0 | 0.0 | 0.0 | 0.0 | 0.0 | 0.0 | 0.0 | 0.0 | ||
| [1987,1992) | 0.0 | 0.0 | 0.0 | 0.0 | 0.0 | 0.0 | 0.0 | 0.0 | 0.0 | 0.0 | 0.0 | 0.0 | 0.0 | 0.0 | 0.0 | 0.0 | 0.0 | ||
| Year | |||||||||||||||||||
| 2017 | 0.0 | 0.0 | 0.0 | 0.0 | 0.0 | 0.0 | 0.0 | 0.0 | 0.0 | 0.0 | 0.0 | 0.0 | 0.0 | 0.0 | 0.0 | 0.0 | 0.0 | ||
| 2016 | 0.0 | 0.0 | 0.0 | 0.0 | 0.0 | 0.0 | 0.0 | 0.0 | 0.0 | 0.0 | 0.0 | 0.0 | 0.0 | 0.0 | 0.0 | 0.0 | 0.0 | ||
| 2015 | 0.0 | 0.0 | 0.0 | 0.0 | 0.0 | 0.0 | 0.0 | 0.0 | 0.0 | 0.0 | 0.0 | 0.0 | 0.0 | 0.0 | 0.0 | 0.0 | 0.0 | ||
| 2014 | 0.0 | 0.0 | 0.0 | 0.0 | 0.0 | 0.0 | 0.0 | 0.0 | 0.0 | 0.0 | 0.0 | 0.0 | 0.0 | 0.0 | 0.0 | 0.0 | 0.0 | ||
| 2013 | 0.0 | 0.0 | 0.0 | 0.0 | 0.0 | 0.0 | 0.0 | 0.0 | 0.0 | 0.0 | 0.0 | 0.0 | 0.0 | 0.0 | 0.0 | 0.0 | 0.0 | ||
| 2012 | 0.0 | 0.0 | 0.0 | 0.0 | 0.0 | 0.0 | 0.0 | 0.0 | 0.0 | 0.0 | 0.0 | 0.0 | 0.0 | 0.0 | 0.0 | 0.0 | 0.0 | ||
| 2011 | 0.0 | 0.0 | 0.0 | 0.0 | 0.0 | 0.0 | 0.0 | 0.0 | 0.0 | 0.0 | 0.0 | 0.0 | 0.0 | 0.0 | 0.0 | 0.0 | 0.0 | ||
| 2010 | 0.0 | 0.0 | 0.0 | 0.0 | 0.0 | 0.0 | 0.0 | 0.0 | 0.0 | 0.0 | 0.0 | 0.0 | 0.0 | 0.0 | 0.0 | 0.0 | 0.0 | ||
| 2009 | 0.0 | 0.0 | 0.0 | 0.0 | 0.0 | 0.0 | 0.0 | 0.0 | 0.0 | 0.0 | 0.0 | 0.0 | 0.0 | 0.0 | 0.0 | 0.0 | 0.0 | ||
| 2008 | 0.0 | 0.0 | 0.0 | 0.0 | 0.0 | 0.0 | 0.0 | 0.0 | 0.0 | 0.0 | 0.0 | 0.0 | 0.0 | 0.0 | 0.0 | 0.0 | 0.0 | ||
| 2007 | 0.0 | 0.0 | 0.0 | 0.0 | 0.0 | 0.0 | 0.0 | 0.1 | 0.0 | 0.0 | 0.0 | 0.0 | 0.0 | 0.0 | 0.0 | 0.0 | 0.0 | ||
| 2006 | 0.0 | 0.0 | 0.0 | 0.0 | 0.0 | 0.0 | 0.0 | 0.0 | 0.0 | 0.1 | 0.0 | 0.0 | 0.0 | 0.0 | 0.0 | 0.0 | 0.0 | ||
| 2005 | 0.0 | 0.0 | 0.0 | 0.0 | 0.0 | 0.0 | 0.0 | 0.0 | 0.0 | 0.0 | 0.0 | 0.0 | 0.0 | 0.0 | 0.0 | 0.0 | 0.0 | ||
| 2004 | 0.0 | 0.0 | 0.0 | 0.0 | 0.0 | 0.0 | 0.0 | 0.0 | 0.0 | 0.0 | 0.0 | 0.0 | 0.0 | 0.0 | 0.0 | 0.0 | 0.0 | ||
| 2003 | 0.0 | 0.0 | 0.0 | 0.0 | 0.0 | 0.0 | 0.0 | 0.0 | 0.0 | 0.0 | 0.0 | 0.0 | 0.0 | 0.0 | 0.0 | 0.0 | 0.0 | ||
| 2002 | 0.0 | 0.0 | 0.0 | 0.0 | 0.0 | 0.0 | 0.0 | 0.0 | 0.0 | 0.0 | 0.0 | 0.0 | 0.0 | 0.0 | 0.0 | 0.0 | 0.0 | ||
| 2001 | 0.0 | 0.0 | 0.0 | 0.0 | 0.0 | 0.0 | 0.0 | 0.0 | 0.0 | 0.0 | 0.0 | 0.0 | 0.0 | 0.0 | 0.0 | 0.0 | 0.0 | ||
| 2000 | 0.0 | 0.0 | 0.0 | 0.0 | 0.0 | 0.0 | 0.0 | 0.0 | 0.0 | 0.0 | 0.0 | 0.0 | 0.0 | 0.0 | 0.0 | 0.0 | 0.0 | ||
| 1999 | 0.0 | 0.0 | 0.0 | 0.0 | 0.0 | 0.0 | 0.0 | 0.0 | 0.0 | 0.0 | 0.0 | 0.0 | 0.0 | 0.0 | 0.0 | 0.0 | 0.0 | ||
| 1998 | 0.0 | 0.0 | 0.0 | 0.0 | 0.0 | 0.0 | 0.1 | 0.0 | 0.0 | 0.0 | 0.0 | 0.0 | 0.0 | 0.0 | 0.0 | 0.0 | 0.0 | ||
| 1997 | 0.0 | 0.0 | 0.0 | 0.0 | 0.0 | 0.0 | 0.0 | 0.1 | 0.0 | 0.0 | 0.0 | 0.0 | 0.0 | 0.0 | 0.0 | 0.0 | 0.0 | ||
| 1996 | 0.0 | 0.0 | 0.0 | 0.0 | 0.0 | 0.0 | 0.0 | 0.0 | 0.0 | 0.0 | 0.0 | 0.0 | 0.0 | 0.0 | 0.0 | 0.0 | 0.0 | ||
| 1995 | 0.0 | 0.0 | 0.0 | 0.0 | 0.0 | 0.0 | 0.0 | 0.0 | 0.0 | 0.0 | 0.0 | 0.0 | 0.0 | 0.0 | 0.0 | 0.0 | 0.0 | ||
| 1994 | 0.0 | 0.0 | 0.0 | 0.0 | 0.0 | 0.0 | 0.0 | 0.0 | 0.0 | 0.0 | 0.0 | 0.0 | 0.0 | 0.0 | 0.0 | 0.0 | 0.0 | ||
| 1993 | 0.0 | 0.0 | 0.0 | 0.0 | 0.0 | 0.0 | 0.0 | 0.0 | 0.0 | 0.0 | 0.0 | 0.0 | 0.0 | 0.0 | 0.0 | 0.0 | 0.0 | ||
| 1992 | 0.0 | 0.0 | 0.0 | 0.0 | 0.0 | 0.0 | 0.0 | 0.0 | 0.0 | 0.0 | 0.0 | 0.0 | 0.0 | 0.0 | 0.0 | 0.0 | 0.0 | ||
| 1991 | 0.0 | 0.0 | 0.0 | 0.0 | 0.0 | 0.0 | 0.0 | 0.0 | 0.0 | 0.0 | 0.0 | 0.0 | 0.0 | 0.0 | 0.0 | 0.0 | 0.0 | ||
| 1990 | 0.0 | 0.0 | 0.0 | 0.0 | 0.0 | 0.0 | 0.0 | 0.0 | 0.0 | 0.0 | 0.0 | 0.1 | 0.0 | 0.0 | 0.0 | 0.0 | 0.0 | ||
| 1989 | 0.0 | 0.0 | 0.0 | 0.0 | 0.1 | 0.0 | 0.0 | 0.0 | 0.0 | 0.0 | 0.0 | 0.0 | 0.0 | 0.0 | 0.0 | 0.0 | 0.0 | ||
| 1988 | 0.0 | 0.0 | 0.0 | 0.0 | 0.0 | 0.0 | 0.1 | 0.0 | 0.0 | 0.0 | 0.0 | 0.0 | 0.0 | 0.0 | 0.0 | 0.0 | 0.0 | ||
| 1987 | 0.0 | 0.0 | 0.0 | 0.0 | 0.0 | 0.0 | 0.0 | 0.0 | 0.0 | 0.0 | 0.0 | 0.0 | 0.0 | 0.0 | 0.0 | 0.0 | 0.0 | ||
| 1986 | 0.0 | 0.0 | 0.0 | 0.0 | 0.0 | 0.0 | 0.0 | 0.0 | 0.0 | 0.0 | 0.0 | 0.0 | 0.0 | 0.0 | 0.0 | 0.0 | 0.0 | ||
| 1985 | 0.0 | 0.0 | 0.0 | 0.0 | 0.0 | 0.0 | 0.0 | 0.0 | 0.0 | 0.1 | 0.0 | 0.0 | 0.0 | 0.0 | 0.0 | 0.0 | 0.0 | ||
| 1984 | 0.0 | 0.0 | 0.0 | 0.0 | 0.0 | 0.0 | 0.0 | 0.0 | 0.0 | 0.0 | 0.0 | 0.0 | 0.0 | 0.0 | 0.0 | 0.0 | 0.0 | ||
| 1983 | 0.0 | 0.0 | 0.0 | 0.0 | 0.0 | 0.0 | 0.0 | 0.0 | 0.0 | - | 0.0 | 0.0 | 0.0 | 0.0 | 0.0 | 0.0 | 0.0 | ||
| 1982 | - | 0.0 | - | 0.0 | 0.0 | 0.0 | - | 0.0 | - | 0.0 | - | 0.0 | 0.0 | 0.0 | 0.0 | 0.0 | 0.0 | ||
Reporting rates
Reporting rate is the proportion of all surveys in which the species was present.
Reporting rate by year
This chart shows the reporting rate of Collared Sparrowhawk each year between 1982 and 2017. 
Reporting rate by month
This chart shows the reporting rate by month of Collared Sparrowhawk. The blue lines show the reporting rate for the twelve months to June 2017 and the bars show the average reporting rate for the period 1982 to 2017. 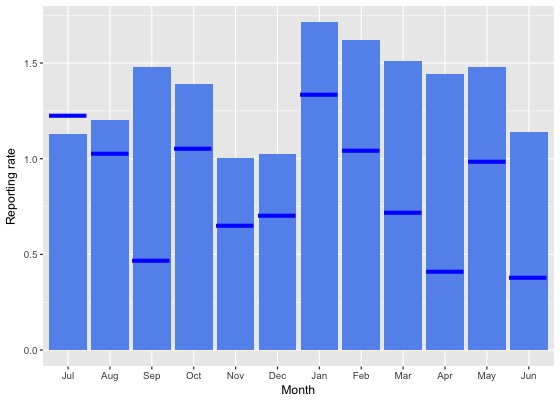
Reporting rate by season
This chart shows the seasonal reporting rate of Collared Sparrowhawk. The blue lines show the seasonal reporting rate for the twelve months to June 2017 and the bars show the average seasonal reporting rate for the period 1982 to 2017. 
Reporting rate data
| Month | Season | ||||||||||||||||||
|---|---|---|---|---|---|---|---|---|---|---|---|---|---|---|---|---|---|---|---|
| Period | Jul | Aug | Sep | Oct | Nov | Dec | Jan | Feb | Mar | Apr | May | Jun | Winter | Spring | Summer | Autumn | All | ||
| All years | |||||||||||||||||||
| All | 1.1 | 1.2 | 1.5 | 1.4 | 1.0 | 1.0 | 1.7 | 1.6 | 1.5 | 1.4 | 1.5 | 1.1 | 1.2 | 1.3 | 1.4 | 1.5 | 1.4 | ||
| Previous years | |||||||||||||||||||
| All previous years | 1.1 | 1.2 | 1.6 | 1.4 | 1.1 | 1.1 | 1.8 | 1.7 | 1.6 | 1.6 | 1.6 | 1.3 | 1.2 | 1.4 | 1.5 | 1.6 | 1.4 | ||
| Previous 30 years | 1.1 | 1.3 | 1.6 | 1.5 | 1.1 | 1.1 | 1.8 | 1.8 | 1.7 | 1.6 | 1.6 | 1.3 | 1.2 | 1.4 | 1.5 | 1.6 | 1.5 | ||
| Previous 20 years | 1.1 | 1.2 | 1.6 | 1.4 | 0.9 | 1.0 | 1.7 | 1.7 | 1.4 | 1.6 | 1.5 | 1.1 | 1.2 | 1.3 | 1.4 | 1.5 | 1.4 | ||
| 10 year groups | |||||||||||||||||||
| [2007,2017) | 1.3 | 1.5 | 1.8 | 1.5 | 0.9 | 1.0 | 1.6 | 1.8 | 1.6 | 1.5 | 1.4 | 1.4 | 1.4 | 1.5 | 1.4 | 1.5 | 1.5 | ||
| [1997,2007) | 0.7 | 0.7 | 1.1 | 1.0 | 0.8 | 1.0 | 2.0 | 1.6 | 1.0 | 1.9 | 1.9 | 0.7 | 0.7 | 1.0 | 1.4 | 1.5 | 1.2 | ||
| [1987,1997) | 1.2 | 1.4 | 2.0 | 1.7 | 1.8 | 1.7 | 2.5 | 1.9 | 3.0 | 1.5 | 1.9 | 2.1 | 1.6 | 1.8 | 2.0 | 2.1 | 1.9 | ||
| 5 year groups | |||||||||||||||||||
| [2012,2017) | 1.4 | 1.4 | 1.6 | 1.3 | 1.0 | 1.2 | 1.5 | 1.6 | 1.8 | 1.5 | 1.3 | 1.2 | 1.3 | 1.3 | 1.4 | 1.6 | 1.4 | ||
| [2007,2012) | 1.0 | 1.6 | 2.3 | 1.9 | 0.7 | 0.6 | 2.0 | 2.5 | 1.1 | 1.7 | 1.8 | 1.7 | 1.5 | 1.8 | 1.5 | 1.5 | 1.6 | ||
| [2002,2007) | 0.7 | 0.8 | 1.0 | 0.9 | 0.4 | 0.9 | 2.3 | 2.1 | 1.2 | 3.1 | 2.4 | 0.9 | 0.8 | 0.8 | 1.6 | 2.1 | 1.3 | ||
| [1997,2002) | 0.8 | 0.6 | 1.3 | 1.1 | 1.2 | 1.1 | 1.6 | 1.1 | 0.9 | 0.5 | 1.1 | 0.4 | 0.6 | 1.2 | 1.2 | 0.8 | 1.0 | ||
| [1992,1997) | 1.2 | 0.2 | 1.0 | 0.8 | 0.4 | 0.3 | 0.3 | 0.7 | 2.5 | 1.4 | 1.6 | 1.3 | 0.9 | 0.7 | 0.4 | 1.8 | 1.0 | ||
| [1987,1992) | 1.2 | 2.0 | 2.5 | 2.3 | 2.4 | 2.3 | 3.7 | 2.3 | 3.2 | 1.6 | 2.0 | 2.6 | 1.9 | 2.4 | 2.7 | 2.2 | 2.3 | ||
| Year | |||||||||||||||||||
| 2017 | 1.2 | 1.0 | 0.5 | 1.1 | 0.7 | 0.7 | 1.3 | 1.0 | 0.7 | 0.4 | 1.0 | 0.4 | 0.8 | 0.8 | 1.1 | 0.7 | 0.8 | ||
| 2016 | 1.6 | 1.2 | 1.8 | 1.1 | 1.0 | 0.5 | 1.6 | 2.1 | 1.7 | 1.7 | 0.6 | 0.8 | 1.2 | 1.3 | 1.5 | 1.4 | 1.3 | ||
| 2015 | 2.1 | 1.8 | 1.4 | 1.5 | 1.2 | 1.3 | 1.8 | 0.9 | 1.3 | 2.0 | 2.3 | 1.6 | 1.8 | 1.4 | 1.3 | 1.8 | 1.6 | ||
| 2014 | 0.6 | 0.4 | 1.6 | 0.8 | 0.0 | 0.7 | 2.0 | 2.2 | 3.4 | 0.8 | 1.5 | 1.8 | 1.1 | 0.9 | 1.8 | 2.1 | 1.5 | ||
| 2013 | 0.0 | 2.3 | 1.4 | 1.3 | 1.3 | 2.1 | 1.1 | 1.5 | 1.6 | 1.4 | 1.7 | 1.1 | 1.1 | 1.3 | 1.6 | 1.5 | 1.4 | ||
| 2012 | 1.6 | 1.6 | 1.5 | 1.7 | 0.8 | 1.6 | 0.4 | 1.0 | 1.5 | 0.6 | 0.5 | 0.3 | 1.1 | 1.4 | 0.9 | 0.9 | 1.1 | ||
| 2011 | 0.8 | 1.6 | 1.6 | 1.6 | 0.0 | 0.3 | 0.3 | 0.9 | 1.2 | 1.3 | 0.4 | 1.5 | 1.4 | 1.3 | 0.4 | 1.0 | 1.0 | ||
| 2010 | 1.0 | 0.9 | 3.4 | 1.5 | 0.0 | 1.8 | 2.4 | 3.5 | 0.8 | 1.7 | 2.9 | 1.5 | 1.3 | 1.7 | 2.3 | 1.5 | 1.7 | ||
| 2009 | 0.7 | 3.1 | 2.3 | 1.5 | 0.4 | 0.0 | 3.3 | 0.8 | 0.9 | 1.2 | 2.3 | 1.4 | 1.5 | 1.5 | 1.3 | 1.4 | 1.4 | ||
| 2008 | 2.1 | 0.9 | 1.9 | 2.9 | 0.7 | 0.5 | 3.2 | 2.8 | 1.1 | 1.6 | 2.7 | 1.9 | 1.7 | 2.3 | 1.8 | 1.6 | 1.9 | ||
| 2007 | 0.0 | 1.9 | 2.5 | 2.0 | 2.7 | 0.3 | 2.8 | 6.1 | 1.3 | 3.0 | 2.4 | 2.3 | 1.8 | 2.3 | 2.2 | 2.2 | 2.2 | ||
| 2006 | 1.3 | 1.9 | 1.8 | 1.3 | 0.0 | 0.6 | 2.8 | 3.0 | 0.9 | 5.4 | 3.6 | 0.4 | 1.0 | 1.1 | 2.0 | 2.7 | 1.7 | ||
| 2005 | 0.7 | 0.9 | 0.4 | 0.6 | 0.0 | 2.0 | 3.5 | 2.2 | 1.7 | 1.1 | 2.5 | 0.8 | 0.8 | 0.3 | 2.5 | 1.8 | 1.3 | ||
| 2004 | 0.8 | 0.0 | 1.4 | 0.6 | 0.6 | 0.0 | 0.6 | 2.0 | 1.0 | 4.4 | 1.9 | 0.6 | 0.5 | 0.9 | 0.6 | 2.5 | 1.1 | ||
| 2003 | 0.9 | 0.0 | 0.8 | 1.6 | 0.9 | 0.8 | 0.7 | 2.7 | 0.9 | 0.5 | 1.6 | 1.9 | 1.0 | 1.1 | 1.4 | 0.9 | 1.1 | ||
| 2002 | 0.0 | 1.7 | 0.5 | 0.4 | 0.5 | 0.9 | 3.8 | 0.7 | 1.4 | 4.8 | 2.4 | 1.1 | 0.8 | 0.5 | 1.5 | 2.7 | 1.3 | ||
| 2001 | 0.0 | 1.2 | 0.3 | 0.4 | 1.1 | 0.4 | 1.0 | 0.0 | 0.6 | 0.5 | 0.6 | 0.0 | 0.3 | 0.5 | 0.4 | 0.6 | 0.5 | ||
| 2000 | 2.4 | 0.0 | 0.9 | 1.3 | 1.4 | 1.3 | 1.7 | 1.4 | 1.6 | 0.4 | 2.7 | 0.5 | 0.9 | 1.2 | 1.5 | 1.4 | 1.3 | ||
| 1999 | 2.9 | 0.0 | 2.3 | 1.3 | 1.3 | 1.2 | 1.5 | 0.0 | 1.1 | 0.5 | 0.6 | 0.9 | 0.9 | 1.6 | 0.9 | 0.7 | 1.0 | ||
| 1998 | 0.0 | 0.0 | 3.3 | 2.2 | 0.9 | 2.8 | 4.4 | 3.8 | 0.0 | 0.0 | 0.0 | 0.0 | 0.0 | 2.1 | 3.5 | 0.0 | 1.7 | ||
| 1997 | 0.0 | 1.7 | 0.9 | 1.3 | 0.9 | 0.0 | 0.0 | 3.5 | 0.0 | 0.9 | 2.2 | 0.0 | 0.5 | 1.0 | 0.9 | 1.0 | 0.9 | ||
| 1996 | 1.5 | 0.0 | 1.3 | 0.0 | 0.0 | 1.0 | 0.0 | 1.2 | 3.9 | 0.0 | 1.7 | 0.0 | 0.4 | 0.3 | 0.7 | 2.2 | 0.9 | ||
| 1995 | 1.1 | 0.8 | 0.0 | 1.2 | 0.0 | 0.0 | 0.9 | 0.0 | 3.1 | 2.4 | 2.6 | 0.0 | 0.6 | 0.5 | 0.4 | 2.7 | 1.0 | ||
| 1994 | 2.0 | 0.0 | 0.0 | 2.3 | 1.5 | 0.0 | 0.0 | 0.0 | 3.4 | 0.0 | 2.5 | 3.4 | 1.8 | 1.4 | 0.0 | 1.7 | 1.3 | ||
| 1993 | 2.0 | 0.0 | 1.6 | 0.0 | 0.0 | 0.0 | 0.0 | 0.0 | 0.0 | 3.3 | 1.3 | 2.9 | 1.5 | 0.5 | 0.0 | 1.4 | 0.9 | ||
| 1992 | 0.0 | 0.0 | 2.4 | 0.0 | 0.0 | 0.0 | 0.0 | 2.4 | 1.4 | 1.7 | 0.0 | 0.0 | 0.0 | 0.8 | 0.6 | 1.0 | 0.6 | ||
| 1991 | 1.6 | 2.1 | 3.5 | 1.0 | 1.0 | 0.0 | 1.8 | 2.0 | 0.0 | 1.7 | 0.0 | 0.0 | 1.5 | 1.7 | 1.1 | 0.5 | 1.3 | ||
| 1990 | 0.6 | 1.6 | 3.2 | 0.0 | 0.0 | 0.0 | 2.8 | 1.4 | 0.0 | 0.0 | 0.0 | 3.9 | 1.7 | 1.0 | 1.4 | 0.0 | 1.1 | ||
| 1989 | 1.0 | 3.0 | 1.7 | 3.5 | 5.6 | 3.0 | 2.7 | 3.6 | 4.4 | 1.0 | 2.6 | 1.8 | 2.0 | 3.5 | 3.1 | 2.7 | 2.8 | ||
| 1988 | 1.7 | 1.5 | 4.5 | 2.0 | 1.7 | 3.1 | 6.5 | 3.4 | 4.0 | 2.1 | 2.5 | 2.4 | 1.8 | 2.5 | 4.4 | 2.9 | 2.8 | ||
| 1987 | 0.0 | 0.0 | 1.2 | 2.7 | 2.4 | 2.4 | 2.6 | 0.8 | 3.8 | 2.1 | 2.2 | 3.4 | 3.0 | 2.1 | 1.9 | 2.6 | 2.3 | ||
| 1986 | 0.0 | 0.0 | 0.0 | 0.0 | 0.0 | 0.0 | 0.0 | 2.8 | 0.0 | 0.0 | 3.4 | 2.9 | 1.0 | 0.0 | 1.1 | 0.9 | 0.7 | ||
| 1985 | 0.0 | 0.0 | 0.0 | 0.0 | 1.8 | 0.0 | 0.0 | 0.0 | 0.0 | 5.3 | 0.0 | 0.0 | 0.0 | 0.5 | 0.0 | 2.5 | 0.5 | ||
| 1984 | 0.0 | 0.0 | 0.0 | 0.0 | 0.0 | 0.0 | 0.0 | 0.0 | 0.0 | 0.0 | 0.0 | 0.0 | 0.0 | 0.0 | 0.0 | 0.0 | 0.0 | ||
| 1983 | 0.0 | 0.0 | 0.0 | 0.0 | 0.0 | 0.0 | 0.0 | 0.0 | 0.0 | - | 0.0 | 0.0 | 0.0 | 0.0 | 0.0 | 0.0 | 0.0 | ||
| 1982 | - | 0.0 | - | 0.0 | 0.0 | 0.0 | - | 0.0 | - | 0.0 | - | 0.0 | 0.0 | 0.0 | 0.0 | 0.0 | 0.0 | ||
Breeding data
Breeding records by month
Number of breeding records by breeding code and month, 2017 and all years| Breeding code | Jul | Aug | Sep | Oct | Nov | Dec | Jan | Feb | Mar | Apr | May | Jun |
|---|---|---|---|---|---|---|---|---|---|---|---|---|
| 2017 | ||||||||||||
| Breeding (BLA code) | 0 | 0 | 0 | 0 | 0 | 0 | 0 | 0 | 0 | 0 | 0 | 0 |
| Carrying Food | 0 | 0 | 0 | 0 | 0 | 0 | 0 | 0 | 0 | 0 | 0 | 0 |
| Copulating | 0 | 0 | 0 | 0 | 0 | 0 | 0 | 0 | 0 | 0 | 0 | 0 |
| Display | 0 | 0 | 0 | 0 | 0 | 0 | 0 | 0 | 0 | 0 | 0 | 0 |
| Dependent young | 0 | 0 | 0 | 0 | 0 | 0 | 0 | 0 | 0 | 0 | 0 | 0 |
| Faecal sac | 0 | 0 | 0 | 0 | 0 | 0 | 0 | 0 | 0 | 0 | 0 | 0 |
| Inspecting hollow | 1 | 0 | 0 | 0 | 0 | 0 | 0 | 0 | 0 | 0 | 0 | 0 |
| Nest building | 0 | 0 | 0 | 0 | 0 | 0 | 0 | 0 | 0 | 0 | 0 | 0 |
| Nest with eggs | 0 | 0 | 0 | 0 | 0 | 0 | 0 | 0 | 0 | 0 | 0 | 0 |
| Nest with young | 0 | 0 | 0 | 0 | 0 | 0 | 0 | 0 | 0 | 0 | 0 | 0 |
| On/leaving nest | 0 | 0 | 0 | 0 | 0 | 1 | 2 | 0 | 0 | 0 | 0 | 0 |
| All years | ||||||||||||
| Breeding (BLA code) | 0 | 0 | 0 | 0 | 0 | 0 | 0 | 0 | 0 | 0 | 0 | 0 |
| Carrying Food | 0 | 0 | 0 | 0 | 1 | 0 | 0 | 0 | 0 | 0 | 0 | 0 |
| Copulating | 0 | 0 | 0 | 0 | 0 | 0 | 0 | 0 | 0 | 0 | 0 | 0 |
| Display | 0 | 0 | 0 | 0 | 0 | 0 | 0 | 0 | 0 | 1 | 0 | 0 |
| Dependent young | 0 | 0 | 0 | 1 | 0 | 0 | 8 | 3 | 0 | 0 | 0 | 0 |
| Faecal sac | 0 | 0 | 0 | 0 | 0 | 0 | 0 | 0 | 0 | 0 | 0 | 0 |
| Inspecting hollow | 1 | 0 | 0 | 0 | 0 | 0 | 0 | 0 | 0 | 0 | 0 | 0 |
| Nest building | 0 | 0 | 2 | 3 | 2 | 1 | 0 | 0 | 0 | 0 | 0 | 0 |
| Nest with eggs | 0 | 0 | 0 | 1 | 0 | 0 | 0 | 0 | 0 | 0 | 0 | 0 |
| Nest with young | 0 | 0 | 0 | 0 | 0 | 1 | 1 | 0 | 0 | 0 | 0 | 0 |
| On/leaving nest | 0 | 0 | 2 | 4 | 0 | 1 | 2 | 1 | 0 | 0 | 0 | 0 |
Breeding records by year
Average number of breeding records per period by breeding code| Period | Breeding (BLA code) | Carrying Food | Copulating | Display | Dependent young | Faecal sac | Inspecting hollow | Nest building | Nest with eggs | Nest with young | On/leaving nest |
|---|---|---|---|---|---|---|---|---|---|---|---|
| All years | |||||||||||
| All | 0.0 | 0.0 | 0.0 | 0.0 | 0.3 | 0.0 | 0.0 | 0.2 | 0.0 | 0.1 | 0.3 |
| Previous years | |||||||||||
| All previous years | 0.0 | 0.0 | 0.0 | 0.0 | 0.3 | 0.0 | 0.0 | 0.2 | 0.0 | 0.1 | 0.2 |
| Previous 30 years | 0.0 | 0.0 | 0.0 | 0.0 | 0.4 | 0.0 | 0.0 | 0.3 | 0.0 | 0.1 | 0.2 |
| Previous 20 years | 0.0 | 0.0 | 0.0 | 0.0 | 0.5 | 0.0 | 0.0 | 0.0 | 0.0 | 0.0 | 0.3 |
| 10 year groups | |||||||||||
| [2007,2017) | 0.0 | 0.1 | 0.0 | 0.1 | 0.8 | 0.0 | 0.0 | 0.1 | 0.0 | 0.0 | 0.3 |
| [1997,2007) | 0.0 | 0.0 | 0.0 | 0.0 | 0.2 | 0.0 | 0.0 | 0.0 | 0.0 | 0.0 | 0.4 |
| [1987,1997) | 0.0 | 0.0 | 0.0 | 0.0 | 0.2 | 0.0 | 0.0 | 0.7 | 0.1 | 0.2 | 0.0 |
| 5 year groups | |||||||||||
| [2012,2017) | 0.0 | 0.2 | 0.0 | 0.2 | 0.6 | 0.0 | 0.0 | 0.0 | 0.0 | 0.0 | 0.0 |
| [2007,2012) | 0.0 | 0.0 | 0.0 | 0.0 | 1.0 | 0.0 | 0.0 | 0.2 | 0.0 | 0.0 | 0.6 |
| [2002,2007) | 0.0 | 0.0 | 0.0 | 0.0 | 0.2 | 0.0 | 0.0 | 0.0 | 0.0 | 0.0 | 0.2 |
| [1997,2002) | 0.0 | 0.0 | 0.0 | 0.0 | 0.2 | 0.0 | 0.0 | 0.0 | 0.0 | 0.0 | 0.6 |
| [1992,1997) | 0.0 | 0.0 | 0.0 | 0.0 | 0.0 | 0.0 | 0.0 | 0.2 | 0.0 | 0.0 | 0.0 |
| [1987,1992) | 0.0 | 0.0 | 0.0 | 0.0 | 0.4 | 0.0 | 0.0 | 1.2 | 0.2 | 0.4 | 0.0 |
| Year | |||||||||||
| 2017 | 0.0 | 0.0 | 0.0 | 0.0 | 0.0 | 0.0 | 1.0 | 0.0 | 0.0 | 0.0 | 3.0 |
| 2016 | 0.0 | 1.0 | 0.0 | 0.0 | 0.0 | 0.0 | 0.0 | 0.0 | 0.0 | 0.0 | 0.0 |
| 2015 | 0.0 | 0.0 | 0.0 | 1.0 | 3.0 | 0.0 | 0.0 | 0.0 | 0.0 | 0.0 | 0.0 |
| 2014 | 0.0 | 0.0 | 0.0 | 0.0 | 0.0 | 0.0 | 0.0 | 0.0 | 0.0 | 0.0 | 0.0 |
| 2013 | 0.0 | 0.0 | 0.0 | 0.0 | 0.0 | 0.0 | 0.0 | 0.0 | 0.0 | 0.0 | 0.0 |
| 2012 | 0.0 | 0.0 | 0.0 | 0.0 | 0.0 | 0.0 | 0.0 | 0.0 | 0.0 | 0.0 | 0.0 |
| 2011 | 0.0 | 0.0 | 0.0 | 0.0 | 0.0 | 0.0 | 0.0 | 0.0 | 0.0 | 0.0 | 0.0 |
| 2010 | 0.0 | 0.0 | 0.0 | 0.0 | 1.0 | 0.0 | 0.0 | 0.0 | 0.0 | 0.0 | 0.0 |
| 2009 | 0.0 | 0.0 | 0.0 | 0.0 | 0.0 | 0.0 | 0.0 | 1.0 | 0.0 | 0.0 | 0.0 |
| 2008 | 0.0 | 0.0 | 0.0 | 0.0 | 2.0 | 0.0 | 0.0 | 0.0 | 0.0 | 0.0 | 3.0 |
| 2007 | 0.0 | 0.0 | 0.0 | 0.0 | 2.0 | 0.0 | 0.0 | 0.0 | 0.0 | 0.0 | 0.0 |
| 2006 | 0.0 | 0.0 | 0.0 | 0.0 | 0.0 | 0.0 | 0.0 | 0.0 | 0.0 | 0.0 | 0.0 |
| 2005 | 0.0 | 0.0 | 0.0 | 0.0 | 0.0 | 0.0 | 0.0 | 0.0 | 0.0 | 0.0 | 0.0 |
| 2004 | 0.0 | 0.0 | 0.0 | 0.0 | 0.0 | 0.0 | 0.0 | 0.0 | 0.0 | 0.0 | 1.0 |
| 2003 | 0.0 | 0.0 | 0.0 | 0.0 | 1.0 | 0.0 | 0.0 | 0.0 | 0.0 | 0.0 | 0.0 |
| 2002 | 0.0 | 0.0 | 0.0 | 0.0 | 0.0 | 0.0 | 0.0 | 0.0 | 0.0 | 0.0 | 0.0 |
| 2001 | 0.0 | 0.0 | 0.0 | 0.0 | 0.0 | 0.0 | 0.0 | 0.0 | 0.0 | 0.0 | 0.0 |
| 2000 | 0.0 | 0.0 | 0.0 | 0.0 | 1.0 | 0.0 | 0.0 | 0.0 | 0.0 | 0.0 | 2.0 |
| 1999 | 0.0 | 0.0 | 0.0 | 0.0 | 0.0 | 0.0 | 0.0 | 0.0 | 0.0 | 0.0 | 0.0 |
| 1998 | 0.0 | 0.0 | 0.0 | 0.0 | 0.0 | 0.0 | 0.0 | 0.0 | 0.0 | 0.0 | 0.0 |
| 1997 | 0.0 | 0.0 | 0.0 | 0.0 | 0.0 | 0.0 | 0.0 | 0.0 | 0.0 | 0.0 | 1.0 |
| 1996 | 0.0 | 0.0 | 0.0 | 0.0 | 0.0 | 0.0 | 0.0 | 0.0 | 0.0 | 0.0 | 0.0 |
| 1995 | 0.0 | 0.0 | 0.0 | 0.0 | 0.0 | 0.0 | 0.0 | 0.0 | 0.0 | 0.0 | 0.0 |
| 1994 | 0.0 | 0.0 | 0.0 | 0.0 | 0.0 | 0.0 | 0.0 | 0.0 | 0.0 | 0.0 | 0.0 |
| 1993 | 0.0 | 0.0 | 0.0 | 0.0 | 0.0 | 0.0 | 0.0 | 1.0 | 0.0 | 0.0 | 0.0 |
| 1992 | 0.0 | 0.0 | 0.0 | 0.0 | 0.0 | 0.0 | 0.0 | 0.0 | 0.0 | 0.0 | 0.0 |
| 1991 | 0.0 | 0.0 | 0.0 | 0.0 | 0.0 | 0.0 | 0.0 | 0.0 | 0.0 | 0.0 | 0.0 |
| 1990 | 0.0 | 0.0 | 0.0 | 0.0 | 0.0 | 0.0 | 0.0 | 0.0 | 0.0 | 0.0 | 0.0 |
| 1989 | 0.0 | 0.0 | 0.0 | 0.0 | 2.0 | 0.0 | 0.0 | 2.0 | 0.0 | 1.0 | 0.0 |
| 1988 | 0.0 | 0.0 | 0.0 | 0.0 | 0.0 | 0.0 | 0.0 | 1.0 | 0.0 | 1.0 | 0.0 |
| 1987 | 0.0 | 0.0 | 0.0 | 0.0 | 0.0 | 0.0 | 0.0 | 3.0 | 1.0 | 0.0 | 0.0 |
| 1986 | 0.0 | 0.0 | 0.0 | 0.0 | 0.0 | 0.0 | 0.0 | 0.0 | 0.0 | 0.0 | 0.0 |
| 1985 | 0.0 | 0.0 | 0.0 | 0.0 | 0.0 | 0.0 | 0.0 | 0.0 | 0.0 | 0.0 | 0.0 |
| 1984 | 0.0 | 0.0 | 0.0 | 0.0 | 0.0 | 0.0 | 0.0 | 0.0 | 0.0 | 0.0 | 0.0 |
| 1983 | 0.0 | 0.0 | 0.0 | 0.0 | 0.0 | 0.0 | 0.0 | 0.0 | 0.0 | 0.0 | 0.0 |
| 1982 | 0.0 | 0.0 | 0.0 | 0.0 | 0.0 | 0.0 | 0.0 | 0.0 | 0.0 | 0.0 | 0.0 |
Distribution map
Distribution - 2017
This map shows the observed distribution of the Collared Sparrowhawk for 2017.
The red circles are the grid cells where Collared Sparrowhawk have been reported.
The transparency of the red circles indicate how many surveys sheets were submitted for that grid cell; the darker the red the more reliable the data. Of the 315 grid cells with reports, 83 had only one sheet; an example is grid number A11.
The size of the circle represents the reporting rate. The maximum reporting rate for Collared Sparrowhawk was 33.3% (eg grid number D14) and the minimum was 0.1% (eg grid number J14). 
Distribution - all years
This map shows the observed distribution of the Collared Sparrowhawk for all years.
The red circles are the grid cells where Collared Sparrowhawk have been reported.
The transparency of the red circles indicate how many surveys sheets were submitted for that grid cell; the darker the red the more reliable the data. Of the 703 grid cells with reports, 55 had only one sheet; an example is grid number U25.
The size of the circle represents the reporting rate. The maximum reporting rate for Collared Sparrowhawk was 100.0% (eg grid number U25) and the minimum was 0.2% (eg grid number S13). 
Breeding map
Breeding - 2017
This map shows the breeding distribution of the Collared Sparrowhawk for 2017.
The red circles are the grid cells where breeding activity for Collared Sparrowhawk have been reported.
The size of the circle represents the number of reports. 
Breeding - all years
This map shows the breeding distribution of the Collared Sparrowhawk for all years.
The red circles are the grid cells where breeding activity for Collared Sparrowhawk have been reported.
The size of the circle represents the number of reports. 